
Indium Price Trend Q2 2026: USA vs China Rates
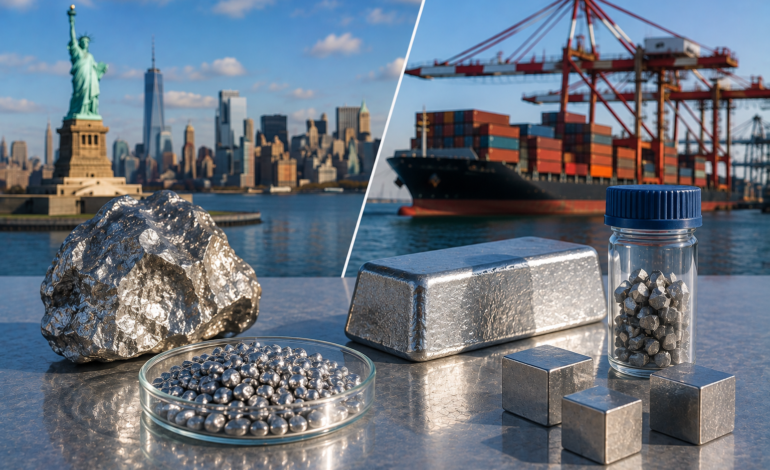
Indium Price Trend Q2 2026: What’s Happening in USA and China Markets
Indium doesn’t get the same attention as gold or copper, but anyone in electronics manufacturing or semiconductor supply chains knows it matters. A lot. The indium price trend for Q2 2026 shows USA rates at USD 735.00/kg FOB in July 2026, while China sits lower at USD 714.75/kg FOB in June 2026.
That’s a gap of about USD 20.25/kg. Small in isolation. Add scale to it, though, and procurement budgets start feeling it.
Indium goes into ITO coatings, touchscreens, solar panels, semiconductors. Cut off the supply or spike the price, and manufacturers in electronics feel it within a quarter, sometimes faster.
Current Indium Prices: USA vs China
| Product | Region | Incoterm Basis | Price | Last Updated |
|---|---|---|---|---|
| Indium | USA | FOB | USD 735.00/kg | July 2026 |
| Indium | China | FOB | USD 714.75/kg | June 2026 |
Price Source :- Procurement Resource
Both quotes are FOB, so at least the basis lines up cleanly here. No CIF versus CFR confusion to untangle. Straightforward comparison.
Timing’s a bit different though. USA’s number is a month newer than China’s. That single-month gap matters more with indium than with bulkier commodities, since indium supply is thin and prices can jump on relatively small shifts in demand.
Quick breakdown:
- USA: USD 735.00/kg, July 2026
- China: USD 714.75/kg, June 2026
- Spread: roughly USD 20.25/kg
Not a massive difference. But indium isn’t traded in huge volumes like steel or aluminum, so even modest spreads carry weight for buyers locking in supply contracts.
Why Indium Prices Behave the Way They Do
Indium’s a byproduct metal. Mostly recovered from zinc ore refining. That alone shapes everything about how its price moves.
Supply is tied to zinc, not indium demand. Producers don’t mine for indium specifically. They extract it while processing zinc, so indium output rises and falls with zinc mining activity, not with electronics demand. When zinc production slows, indium supply tightens regardless of how much the tech sector wants.
China dominates refining capacity. Roughly half the world’s indium refining happens in China. That gives Chinese producers real pricing leverage, and it partly explains why China’s FOB rate often runs below USA quotes. Shorter supply chains, closer proximity to refining hubs.
Electronics demand keeps climbing. Touchscreens, semiconductors, thin-film solar. All three sectors lean on indium, and demand from these industries has been steady even when broader commodity markets soften.
Export policy risk. China has flagged rare and strategic metals for export controls before. Any tightening there ripples through global indium supply fast, given how concentrated production already is.
Quick Questions Buyers Are Asking
Is the USA-China gap normal, or unusual?
Fairly normal, actually. China’s refining scale tends to keep its FOB price a touch below USA rates most months. A USD 20/kg spread isn’t alarming.
Should buyers expect prices to keep rising?
Hard to say with certainty. Electronics demand is steady, supply is byproduct-linked and inflexible. Together, that combination tends to push prices upward over time, though short-term dips do happen.
Does the one-month data gap between USA and China matter?
Somewhat. Indium prices can shift meaningfully within a single month given thin trading volumes. Treat the China figure as slightly dated compared to the July USA number.
What This Means for Buyers and Investors
Electronics manufacturers sourcing indium should watch the China figure closely. Not because it’s always cheaper, but because China’s refining dominance means shifts there tend to set the tone for global pricing.
Investors eyeing rare metals exposure might find the byproduct nature of indium interesting from a risk angle. Supply doesn’t respond to demand the way primary metals do. Zinc mining economics drive indium output, so a slowdown in zinc production, even with red-hot electronics demand, can still tighten indium supply and push prices up.
Procurement teams negotiating long-term contracts should factor in China’s export policy history. A single announcement on rare metal controls has moved indium markets before, and thin supply chains amplify that kind of shock.
Looking Ahead: Q2 2026 Outlook
Byproduct economics plus steady electronics demand plus concentrated Chinese refining. That combination points toward continued price firmness through Q2 2026, barring a major slowdown in zinc mining or a sudden demand drop in electronics.
Watch China’s export policy stance closely. Any new restriction, even a minor one, could widen the gap between USA and China pricing quickly.
Buyers locking in supply now should treat both figures as recent, not current. A month-old China quote next to a fresh USA one means real-time pricing could already look different by the time contracts get signed.
Conclusion
The indium price trend for Q2 2026 puts USA rates at USD 735.00/kg FOB and China at USD 714.75/kg FOB, roughly a USD 20.25/kg spread. Byproduct supply dynamics, China’s refining dominance, and steady electronics demand all sit behind these numbers. For anyone sourcing indium or watching rare metal markets, this gap is worth tracking closely heading into the rest of 2026.
FAQ Section
What is the current indium price trend for USA and China?
USA indium is priced at USD 735.00/kg FOB as of July 2026. China’s rate sits at USD 714.75/kg FOB, last updated June 2026. The roughly USD 20.25/kg spread reflects China’s refining dominance and the one-month gap between quotes.
Why is indium considered a byproduct metal, and why does that matter for pricing?
Indium comes mostly from zinc ore refining rather than dedicated mining. Supply depends on zinc production levels, not electronics demand directly. That disconnect means indium prices can rise even when overall metal demand is flat, since output stays tied to zinc mining economics.
What industries drive indium demand the most?
Electronics manufacturing leads, especially touchscreen coatings using indium tin oxide, semiconductor components, and thin-film solar panels. Demand from these sectors has stayed fairly consistent, which keeps upward pressure on prices even when other commodity markets soften.
How does China’s refining dominance affect global indium prices?
China controls roughly half of global indium refining capacity. That concentration gives Chinese producers pricing influence and often keeps China’s FOB rate below USA quotes. It also means any policy shift in China, like export controls, can move global prices quickly.
What’s the outlook for indium prices through Q2 2026?
Prices look set to stay firm, driven by steady electronics demand and byproduct supply limits tied to zinc mining. Watch for any Chinese export policy changes, since thin global supply chains mean even small restrictions could push prices higher fast.
Also Read :- Butyl Acetate Price Trend






1 Comment
[…] Also Read :- Indium Price Trend […]